5 Ways to Enhance the QSR Experience for Customers using Video Analytics
QSR or Quick Service Restaurants, are eateries that are categorized by a primary focus on fast, speedy customer service. In this article, we explore the top five ways in which the qsr customer experience can be enhanced, and how video analytics plays a role in doing so.
Published
October 11, 2023

What is a QSR?
A QSR refers to a Quick Service Restaurant. This is a category of eateries that offers limited seating and table services, and focuses instead on quick customer service. It is here that customer service reigns supreme, with business owners turning to smart technology to help streamline the workflow.
Camera-based video analytics can be implemented by users to collect, process, and analyze video data - to give rise to actionable insights. These insights have the advantage of being data-driven and can, therefore, be used to better understand customer behavior, needs, and pain points. It is imperative that the customer needs be addressed in way that boost sales.
QSRs tend to be smaller establishments, typically fast-casual dining kiosks, cafes, or booths that serve food which can be cooked and consumed quickly. Think, a KFC drive-thru, a falafel stand, or a frozen yoghurt establishment.
How is CX defined in Quick Service Restaurants (QSR)?
Customer experience (CX) in the context of QSRs refers to the overall experience a customer has - starting from waiting to order, till receiving said order. It also includes any and all interactions the customer has with physical and digital touchpoints such as interaction with the staff, digitally placing an order, and post-purchase support.
Customers tend to form queues at quick service restaurants - whether on foot, or inside vehicles. In both cases, queue management forms an integral part of the customer journey. Factors such as reduced wait times, ease of navigation, and drive layout (in case of a drive-thru) have to be carefully planned and optimised.
By monitoring operations in a consistent manner, users can access valuable customer intelligence and build a database that sheds light on relevant KPIs.
An example of this could be monitoring footfall during peak hours and deploying more staff in these durations to keep up with the increased demand. Another example could have to do with parking management - drive-thrus can get incredibly busy during rush hours. Ensuring that there is adequate parking space for cars guarantees that business will not be lost. Drive-thrus generally employ a Parking Management System (PMS) to help with their parking needs.
5 Strategies for Enhancing the QSR Experience for Customers
Queue Management
A crucial part of how a QSR functions is through queues. They typically operate on a first-come first-serve basis, where the customers line up and wait their turn to place their order. There is a separate queue for picking up orders. A customer who has finished placing their order is free to go and join the back of the pickup queue.
The above method refers to a linear approach of queue management. There is also the circular layout - most commonly found in drive-thrus. The layout is such that the order and pickup kiosks are placed parallel to each other - enabling cars to go around in a circle and pick up their order. This eliminates the need for a separate queue, and prevents overcrowding.
.jpg)
A Queue Management System (QMS) is generally employed, where the queues in question are automatically managed. To state an example, Isarsoft Perception’s functionality in queue management allows users to measure and monitor occupancy, measure speed, dwell times, and chart trajectory maps for detected objects.
Parking Management
Why are parking facilities important for QSRs? The answer is simple. In the absence of seating and table service options, vehicles are where customers often choose to do their waiting, and consequently, partaking in the food they just bought. It is, thereby, absolutely essential that quick service restaurants come equipped with well-managed parking lots that allow for the customer experience to be greatly improved.
Camera-based video analytics can help restaurant owners keep track of parking space availability at all times, enabling them to guarantee customers a hassle-free parking process. In case of overcrowding, personnel can choose to put entry control factors in place. An example of this would be a digital sign board stating that maximum capacity has been achieved, and an invitation to return once the predicted wait time is reached.
Digital signage
Digital signage refers to digital communication in the form of messaging and markers that are used to improve customer perception and service. Video analytics are often used to facilitate these services.
In the context of QSRs, digital signage can be of particular use in helping optimize the experience of waiting in a queue. They can be used to display expected wait times, pertinent information necessary for a hassle-free ordering and pickup process, directions to the closest exit, available parking spots, etc.
They can also be used to provide additional support for the elderly or vulnerable.
People Flow Analysis
Analyzing the flow of people is often the first step to understanding customer behavior on a closer level and consequently scaling it to drive more efficient customer experiences. Particularly crucial in the context of QSRs, which need to guarantee a steady standard of customer service, people flow analysis finds quite a few uses in the context.
As discussed earlier under 'Queue Management', video analytics measure and assess people/vehicles in queues. This, in turn, creates what is commonly referred to as a 'people flow' - the flow of people through navigable areas. To state an example, a people flow in a typical QSR would mean the trajectory a person takes from joining the queue and placing an order, to receiving their order and exiting. Studying this flow helps uses better understand the typical customer journey, and how it can be improved through the identification of problem areas.

People flow analysis reveals other information too - and can be studied to create a database of collective and individual customer experiences.
Dwell Time Measurement
The measurement of dwell time, typically, is a process designed to measure the time a customer spends in wait. This could be during them joining a queue, searching for a parking spot, or in line for pickup. The overall figure serves as indicator of existing efficiency, and can be used to further streamline customer service processes.
Isarsoft Perception allows users access to highly detailed dwell-time maps - color-coded maps that efficiently visualize large volumes of video data to give the user an accurate and reliable picture of the situation they are monitoring. For reference, red is for areas wherein the detected objects are moving slowly, ergo, have high dwell time. Yellow is for areas with relatively lower dwell times, and blue is for the regions where dwell time is minimal. Read more about heat maps in Isarsoft Perception here.
Dwell time measurement can also be used for further actions such as infrastructure analysis, trajectory mapping, staff deployment, and optimal resource usage. By doing this, users also give their customers a much-enhanced journey through the QSR - since the collected data can be used for predictive signage that lets a customer know of how long they need to wait.
How does Isarsoft Perception help Enhance the Customer Experience?

The above image represents a streamlined version of customer experience analytics. It is in the context of dwell time - the top figure depicts 85% of the total customers having waited less than 5 minutes in line for order placement, while the bottom figure shows that 81% waited less than five minutes in line for picking up their orders.
Isarsoft Perception collects, processes, and analyzes video data to generate insights like the above and more. In addition, users can make use of features such as heat maps, line and zone creation, and trajectory mapping to conduct an in-depth analysis that reveals information about occupancy, speed of detected objects, volume, etc.
By having access to this information, users can tap into the data-driven infrastructure of Isarsoft Perception - one that aims to give customers a 360 degree understanding of customer journeys and how they can be improved in a scalable way.
More about Isarsoft
With Isarsoft Perception, your camera systems become part of your business intelligence. Whether the goal is to increase efficiency, customer satisfaction or safety, Isarsoft Perception provides the insights needed for informed decisions.
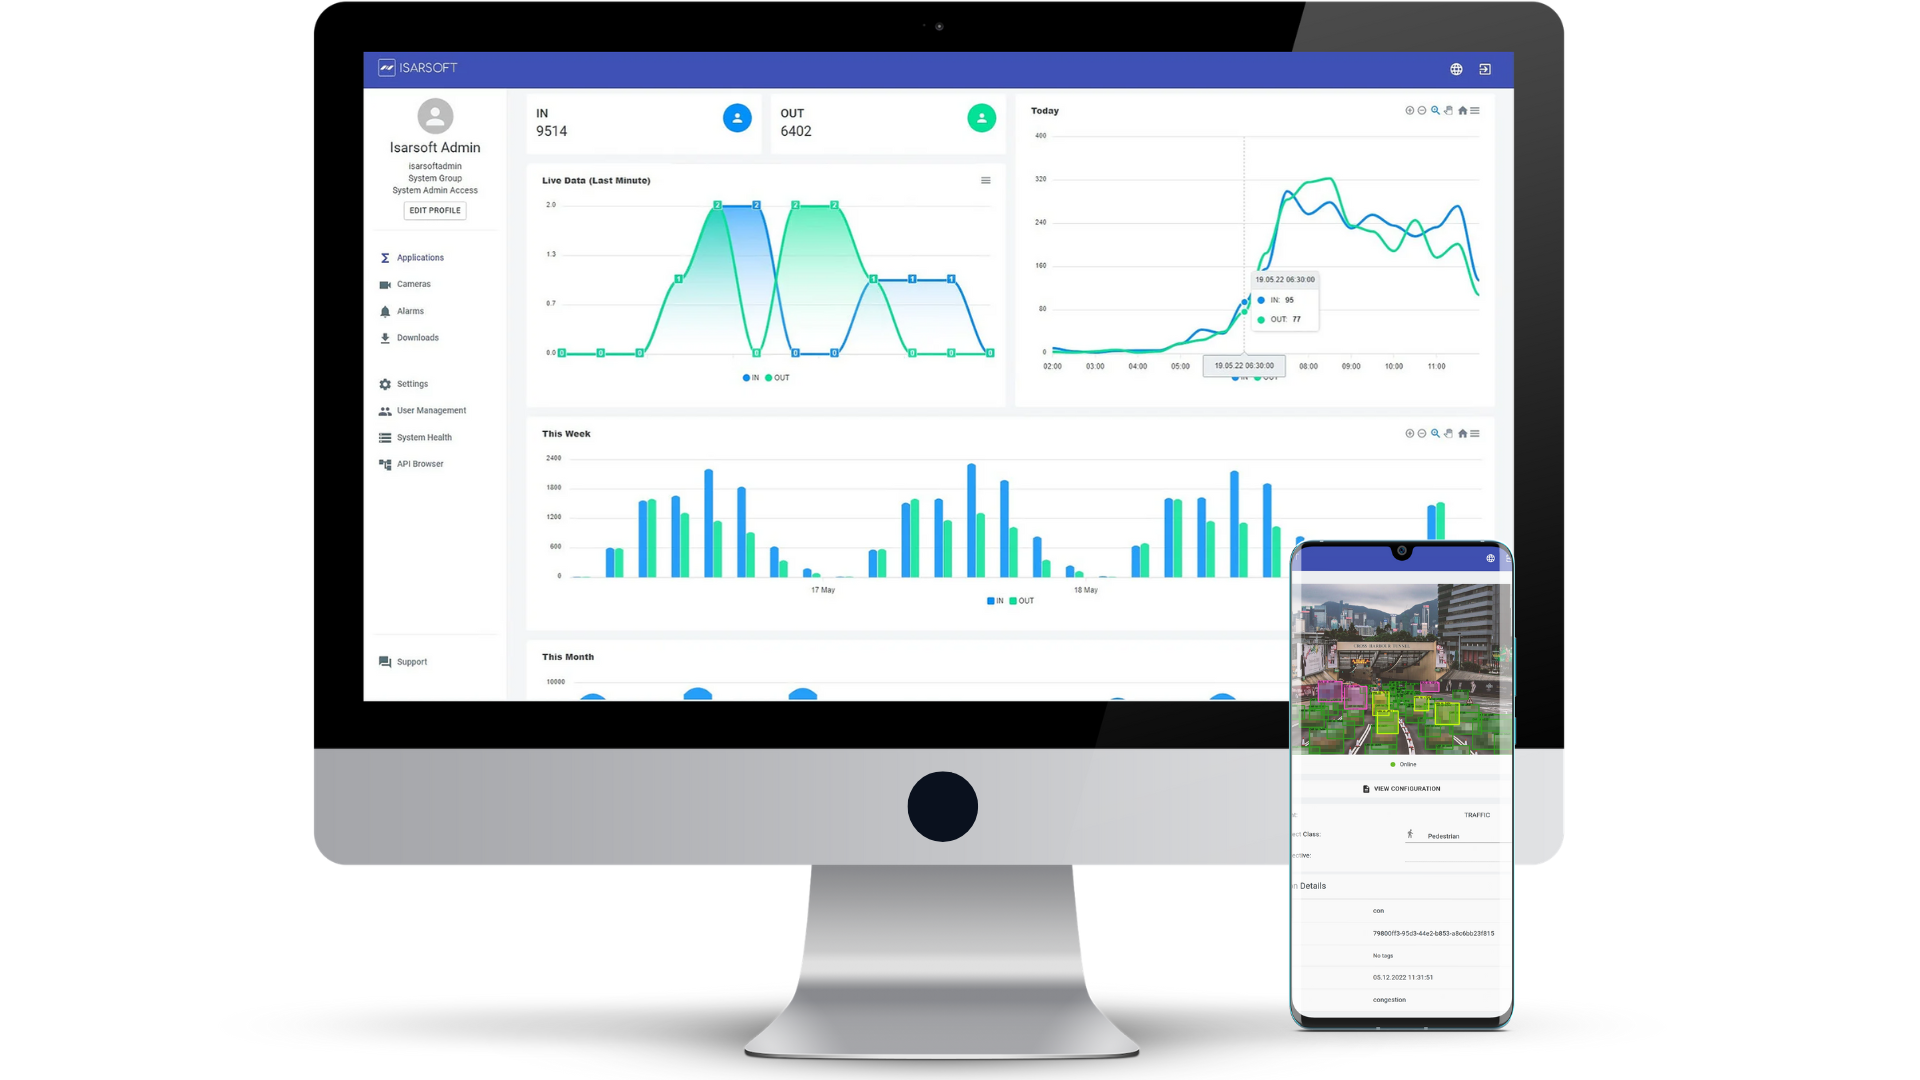
Contact us, to learn more about how to turn security cameras into intelligent sensors.
Optimize your business processes.
Improve business processes with video-based business intelligence from Isarsoft.


.webp)