Automatic Passenger Counting in Trains With Cameras
It is the challenge of mobility providers to measure and predict these various long-term and short-term factors and adjust services accordingly.
Published
January 15, 2020

Trains, subways and streetcars are key to improving transportation within and between cities. As urbanization causes cities and traffic to grow rapidly, so does the need for public transportation.
Demand and usage patterns can change for a variety of reasons. While new neighborhoods, infrastructure projects, new companies and employers have long-term impacts, rush hour, events, demonstrations and festivals provide short-term spikes. Shifting customer preferences and alternative services have a further impact on the demand of public transport vehicles.
It is the challenge of mobility providers to measure and predict these various long-term and short-term factors and adjust services accordingly. In order to obtain ridership data, the provider must conduct ridership counts or have them conducted. While there are several passenger counting strategies that will be covered in detail in another article, this article describes how security cameras on trains can be used for passenger counting.
Security Cameras in Trains and Busses
Security cameras are often already installed in trains, subways or busses to increase passenger safety and prevent vandalism. Using these existing cameras instead of dedicated sensors can reduce passenger counting costs by up to 80%.
The image below shows two typical floor plans of public transport vehicles, including the position of the mounted cameras. As can be seen, several cameras are installed per car to cover the entire area.
Depending on the position and mounting of the cameras, the perspective of the camera and the counting results obtained vary:
- If the cameras only capture the inside of the train, the total number of passengers and the total difference between stations can be determined. We call this type of application utilization application.
- Additionally, if the vehicle entrance areas are clearly visible, the exact number of people entering and exiting each station can be measured. This is one scenario where a count line application could be used.
Train floor plan 1 in the image corresponds to number one in the list. While train floor plan 2 can also record the exact number of passengers boarding and alighting due to the additional cameras 5, 6 and 7.

Using cameras for passenger counting
The colored overlays in the image below illustrate the counting zones. As you can see, cameras one through four create four counting zones (yellow, red, green, blue) in which passengers are counted. By adding the numbers from each zone, the total occupancy of the vehicle is obtained.
In the second layout, six additional count lines are shown as blue horizontal lines measuring passengers boarding and alighting from cameras 5, 6 and 7.

Following this example of one car, passenger counting can be performed for an entire vehicle. If aggregated even further, even the entire public transport network can be covered. We will provide a detailed description of this in another article.
Provision of the counting results
Most cameras already installed are not smart enough to perform passenger counting as accurately as public transportation providers require. Instead, an additional device is often needed to perform the calculation. This can be the vehicle's on-board computer, a server in the operator's data center, or a server in the cloud.
In any case, there must be a data connection from the vehicle to the operator. Bandwidth requirements are lowest for on-board computing. For image processing outside the train, bandwidth can be saved by only evaluating the compressed low-resolution images from the cameras every X seconds.
Set up video analytics
Setting up Isarsoft video analysis solutions is a matter of a few mouse clicks. Thanks to the interactive drag & drop interface, counts can be configured easily.
For the utilization application, the counting areas for each camera are adapted in the form of rectangles. These correspond to the counting zones from above.
For the application of the counting line, a line in the middle of the doors must be configured to count people entering or leaving the vehicle.

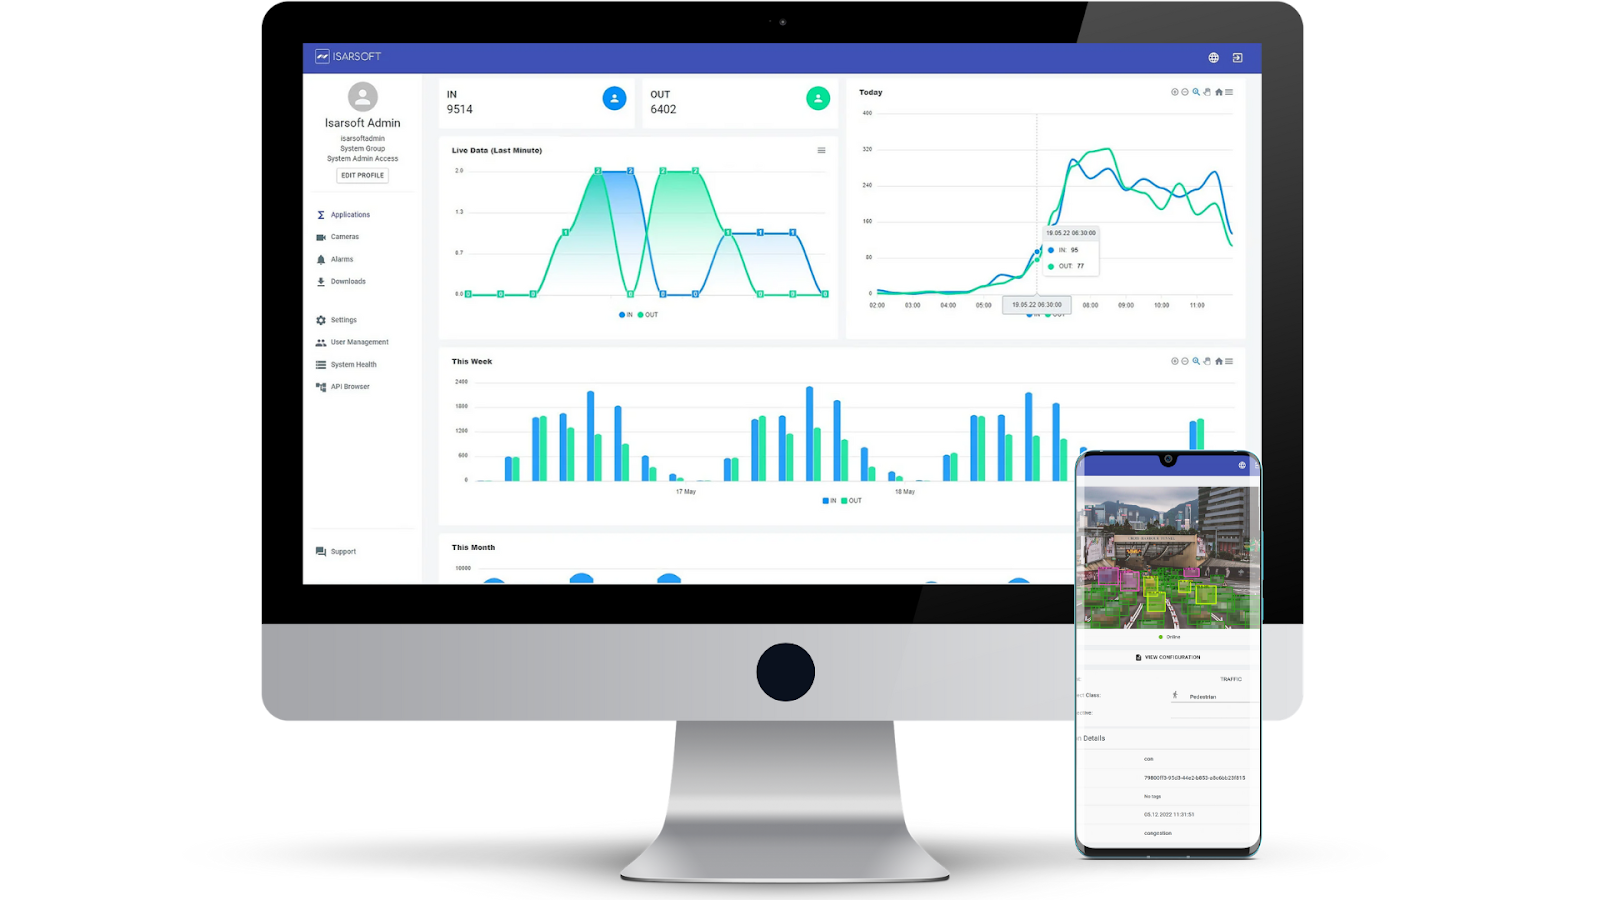
Analyze the data
The Isarsoft dashboard provides all the statistics you need. For simplicity it has predefined time ranges like:
- last hour
- last 24 hours
- last 30 days
to display either microscopic or macroscopic trends. For more detailed analysis, one can also select a custom time range or export the data to Excel format. In either case, data from multiple cameras can be aggregated to capture the bigger picture.
In our article about fleet utilization and management, we describe how the data can be further processed.

More about Isarsoft
With Isarsoft Perception, your camera systems become part of your business intelligence. Whether the goal is to increase efficiency, customer satisfaction or safety, Isarsoft Perception provides the insights needed for informed decisions.
Contact us, to learn more about how to turn security cameras into intelligent sensors.
Explore More Publications
.png)
Transforming Public Transport: Isarsoft at InnoTrans 2026
Isarsoft is excited to announce our participation in the InnoTrans 2026, the international trade fair for transport technology. Join us in Berlin in September to explore how intelligent video analytics can revolutionize passenger counting in vehicles and stations.

Join Isarsoft at the PTE World 2026 in London
Isarsoft is excited to announce our participation in the PTE World 2026, the world’s leading international airport trade fair. Join us in London this March to explore how intelligent video analytics can revolutionize security and passenger flow at airports.

Meet Isarsoft at the EuroShop 2026 in Düsseldorf
Isarsoft is excited to announce our participation in the EuroShop 2026, the world’s no. 1 retail trade fair. Join us in Düsseldorf this February to explore how intelligent video analytics can revolutionize customer journeys in retail.