Performance Measurement in Road Traffic - Top 10 KPIs for Every Traffic Planner
The analysis of road traffic is made easier when traffic planners use carefully chosen, systematic indicators to assess overall performance. In this article, we take a look at the world of traffic and which KPIs are likely to rank at the top for planners.
Published
April 19, 2023
.avif)
What is a KPI?
KPI is short for Key Performance Indicator- a term used to denote quantifiable performance measurement.
KPIs are used to assess the performance of a subject based on a roster of predefined criteria, and use the data to improve and alter operational processes, analyze efficacy and make relevant decisions.
Top 10 KPIs in Road Traffic
Level of Service
Level of Service, a term abbreviated to LOS, is a measure of quality used to describe operational conditions within a traffic stream. These conditions are usually in the form of service measures such as speed and travel times, convenience, freedom to manoeuvre and forms of traffic interruptions.
There are six types of LOS, ranked from A-F and depending upon operating conditions.

Average Daily Traffic
Average Daily Traffic (ADT) or Mean Daily Traffic is a metric used to determine the average number of vehicles that travel through a specific point or zone of the road. This figure is calibrated over a relatively short period of time, usually less than or equal to a week.
Having an average but accurate estimate of the number of vehicles in transit helps planners make long-term decisions related to traffic volume such as lighting, signage, infrastructure-related development and parking facilities.
Coordinated Traffic Signals
Coordinate Progressive Signal - These signals are operated through coordination and help maintain a constant flow of traffic. They are usually deployed in areas that receive high volumes of traffic on a regular basis.
Coordinated Traffic Adaptive Signal - Usually deployed in areas that witness rapid demand shifts, this system of signaling identifies peak demand times and adjusts the signal accordingly. The primary objective is to manage traffic in an adaptive manner via means of coordination.
Pedestrian Counter
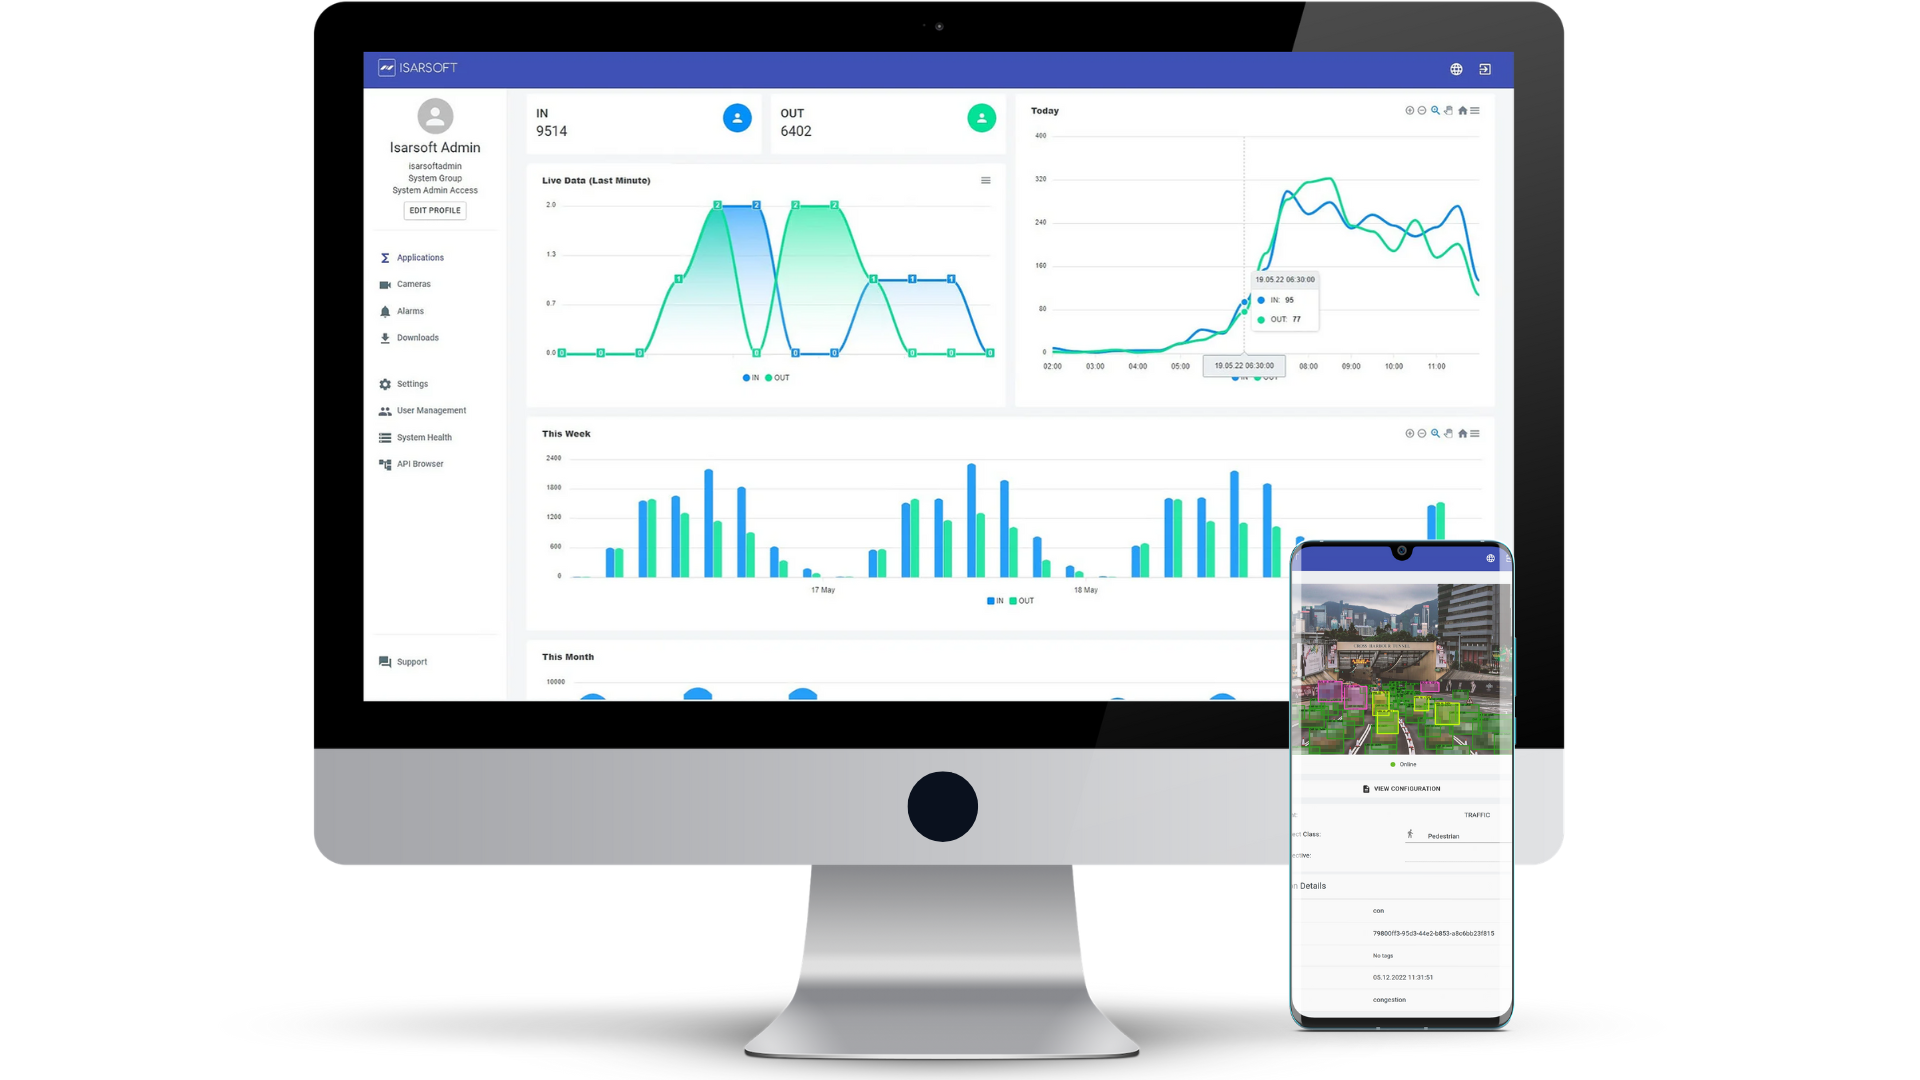
Roadways and traffic are as much about pedestrians as they are about vehicles. The use of video analytics tools such as Isarsoft Perception allows traffic planners to keep a running tally of the footfall statistics in a given stretch of road.
Measuring pedestrian traffic can be done by means of a pedestrian counter. The existence of this data is useful for development, safety enhancement and other related functions.
Origin-Destination Matrix
The Origin-Destination Matrix, also known as the OD-Matrix, is a way of describing the relation between traffic origin and traffic destination in the form of a table. It can be used to describe movement in a certain area and thereafter, assess the demand for transportation in the given area.
An important tool that is used to design efficient transportation systems, OD matrices prove very useful for traffic intersection management. They numerically depict the traffic flow at an intersection within a specific amount of time.
Traffic Density
Traffic Density points to the number of vehicles present on a given stretch of road. The density is calibrated on the basis of the number of vehicles per kilometer or mile. A high traffic density indicates that the number of vehicles per kilometer are many, and that the individual vehicles are close to each other.
By accessing traffic density statistics, traffic planners can estimate traffic congestion and thereby, implement quicker methods of traffic management and clearance.
It can also help personnel detect cars that may be tailgating or breaking other traffic rules.
Roadway Capacity
Roadway Capacity is a metric that helps planners determine the maximum sustainable hourly flow rate (of traffic), at which vehicles can be expected to traverse a particular point, zone or stretch of roadway. This rate is measured in 15-minute intervals, usually, and after taking into account current traffic conditions.
A popular tool to increase road capacity during situations of high demand in traffic is via Hard Shoulder Running (HSR), which enables the use of hard shoulders as an extra driving lane.
Bicycle Counter
A bicycle counter is a device used to count the number of cyclists in a given stretch of road. As with pedestrians and vehicles, bicycles form an integral part of traffic systems and must be accounted for.
By monitoring the number of bicycles that ply roads on a daily basis, planners are better able to make the necessary provisions such as addition or alteration of bike lanes, signage, lighting and other methods of ensuring safety.
Vehicle-to-Everything (V2X)
Vehicle-to-Everything or V2X is a metric that maps the communication between a vehicle and an entity, any entity, that may affect or be affected by the vehicle in question.
This metric is used to identify and detect patterns, study vehicular behavior, and amp up preventative maintenance to reduce the likelihood of accidents and injuries.
Variable Speed Limit
Variable Speed Limit, also known as VSL, is an active traffic management strategy that is used to slow down traffic before and through specific conditions with the use of dynamic speed limits. By being able to access VSL as a key performance indicator, traffic planners can ensure the efficiency and safety of moving traffic in conditions affected by congestion, unfavorable weather conditions, etc.
VSL can be classified according to two commonly found types:
Congestion-responsive VSL - This is used to manage traffic flow in situations that are likely to experience congestion such as an accident or rush hour traffic. The system slows down traffic in anticipation of congestion to diminish hard deceleration and stop-and-go conditions.
Weather-responsive VSL - The system detects unfavorable and potentially dangerous weather conditions such as rain, snow, fog and reduces the speed of traffic flow to avoid safety hazards.
More about Isarsoft
With Isarsoft Perception, your camera systems become part of your business intelligence. Whether the goal is to increase efficiency, customer satisfaction or safety, Isarsoft Perception provides the insights needed for informed decisions.
Contact us, to learn more about how to turn security cameras into intelligent sensors.
Optimize your business processes.
Improve business processes with video-based business intelligence from Isarsoft.


.webp)